ICBC and BC Injury Research and Prevention Unit · 2025–2026
Red-light camera site selection for ICBC
Where should ICBC put its next red-light cameras, when most of the data a standard method needs is missing?
- signalized intersections modelled
- 1,500
- lower prediction error
- 60%
- per uncertainty run, down from hours
- < 30 s
- budget range the dashboard covers
- $1M–$10M
The standard method needed data BC doesn't have.
ICBC needed to choose red-light camera sites across BC. Traffic volumes were missing for most of the province's 20,000+ intersections, crash costs were still pending, and a camera also changes crashes at the intersections around it.
Let neighbours stand in for missing volumes.
Built a BYM2 spatial Bayesian model for 1,500 signalized intersections that borrows strength from nearby sites where volumes were missing.
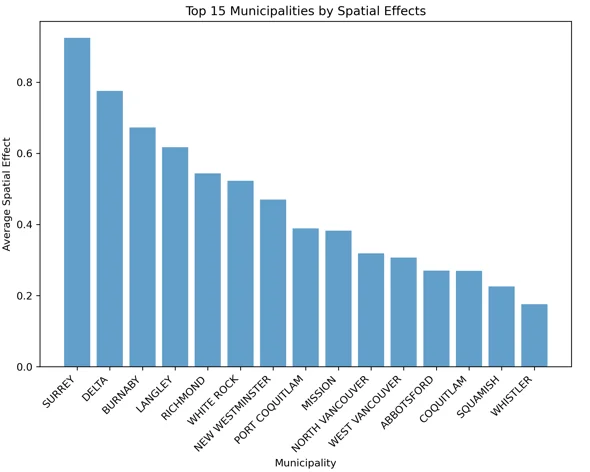
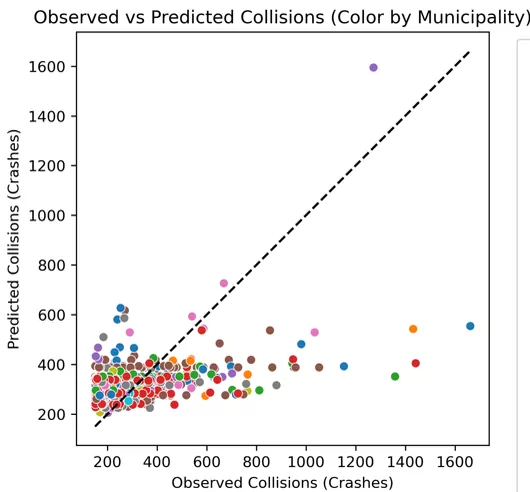
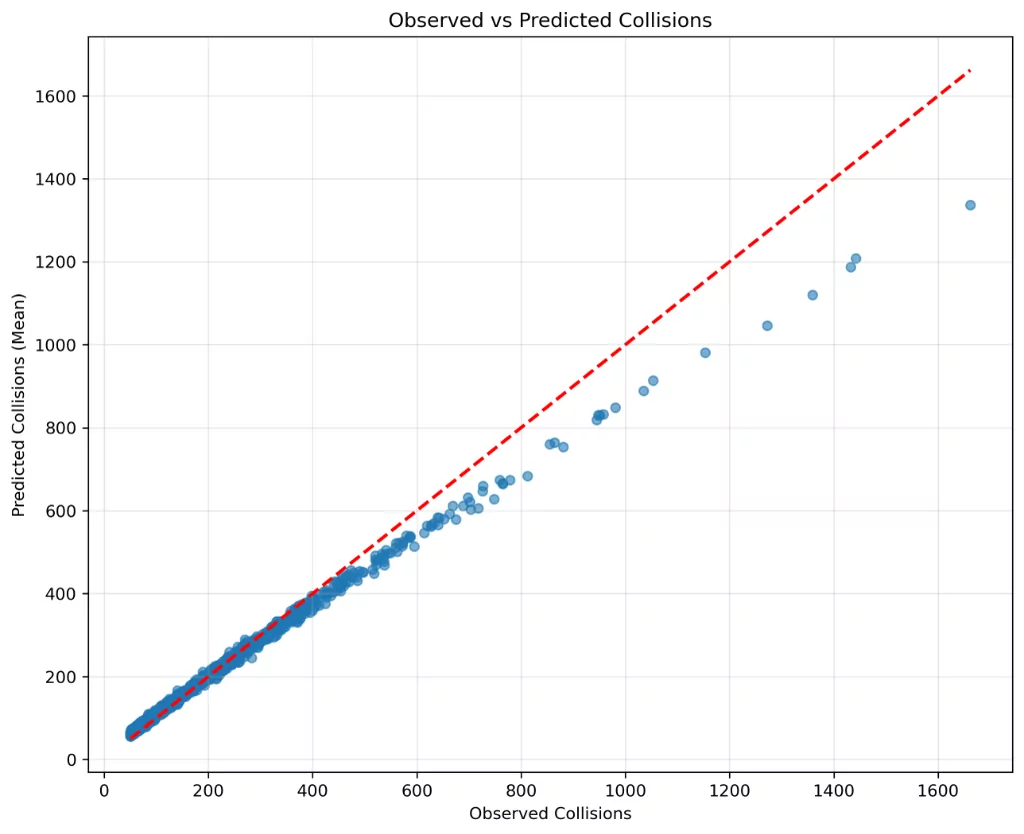
The spatial model fixes the worst predictions.
Prediction error fell 60% against a model without spatial correlation.
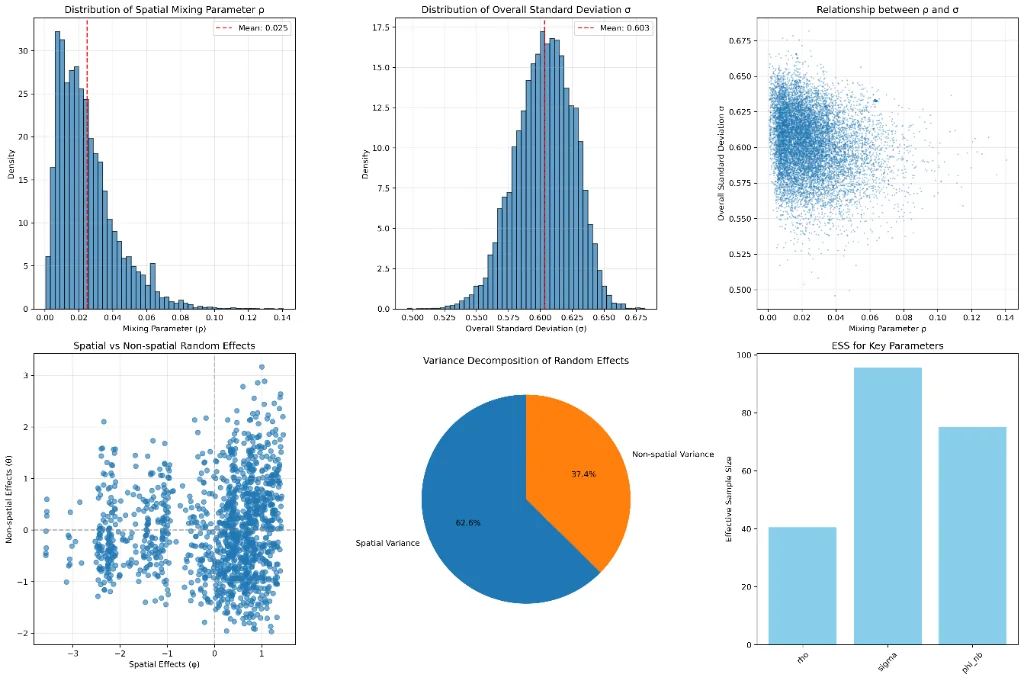
Most of the variation is about place.
Variance decomposition: 62.7% of the variance is spatial.
Uncertainty carried all the way to the decision.
Propagated the uncertainty with GPU Monte Carlo (CuPy), cutting run time from hours to under 30 seconds.
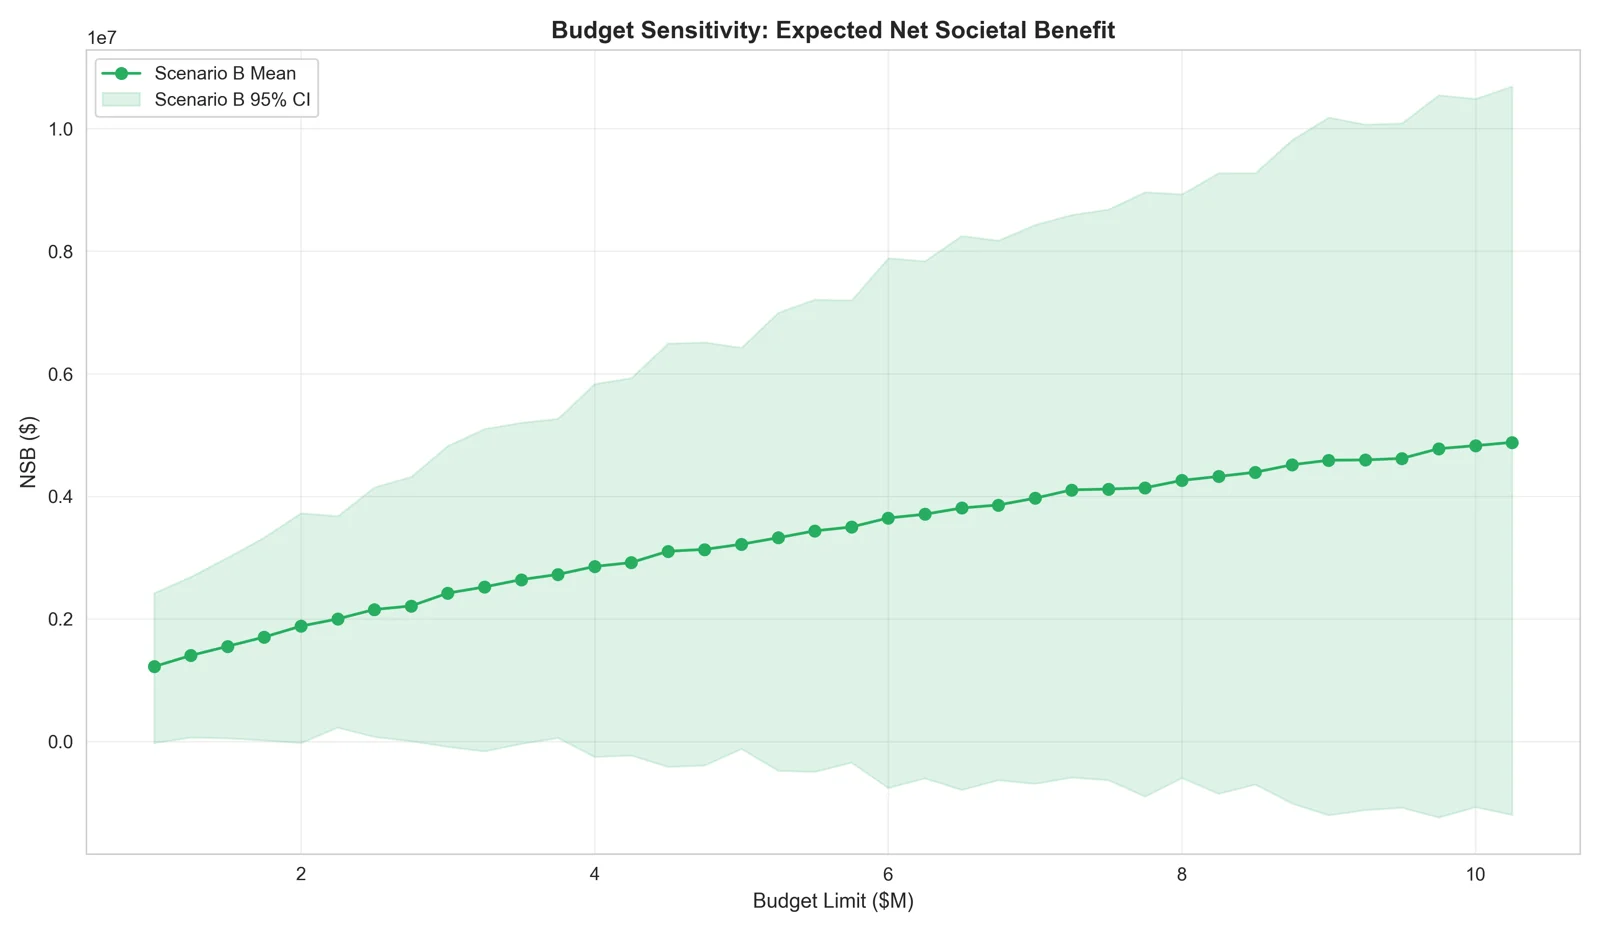
Choose sites as a portfolio, not a ranking.
Optimized site choice with mixed-integer programming and a GPU genetic algorithm under three assumptions: direct effect only, a 1 km halo, and a 2 km spillover.
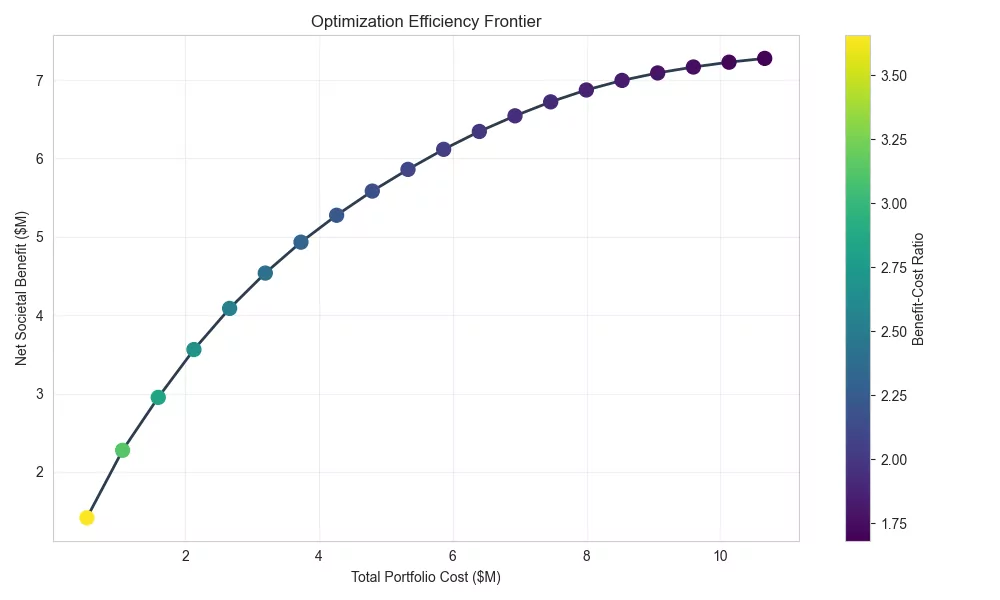
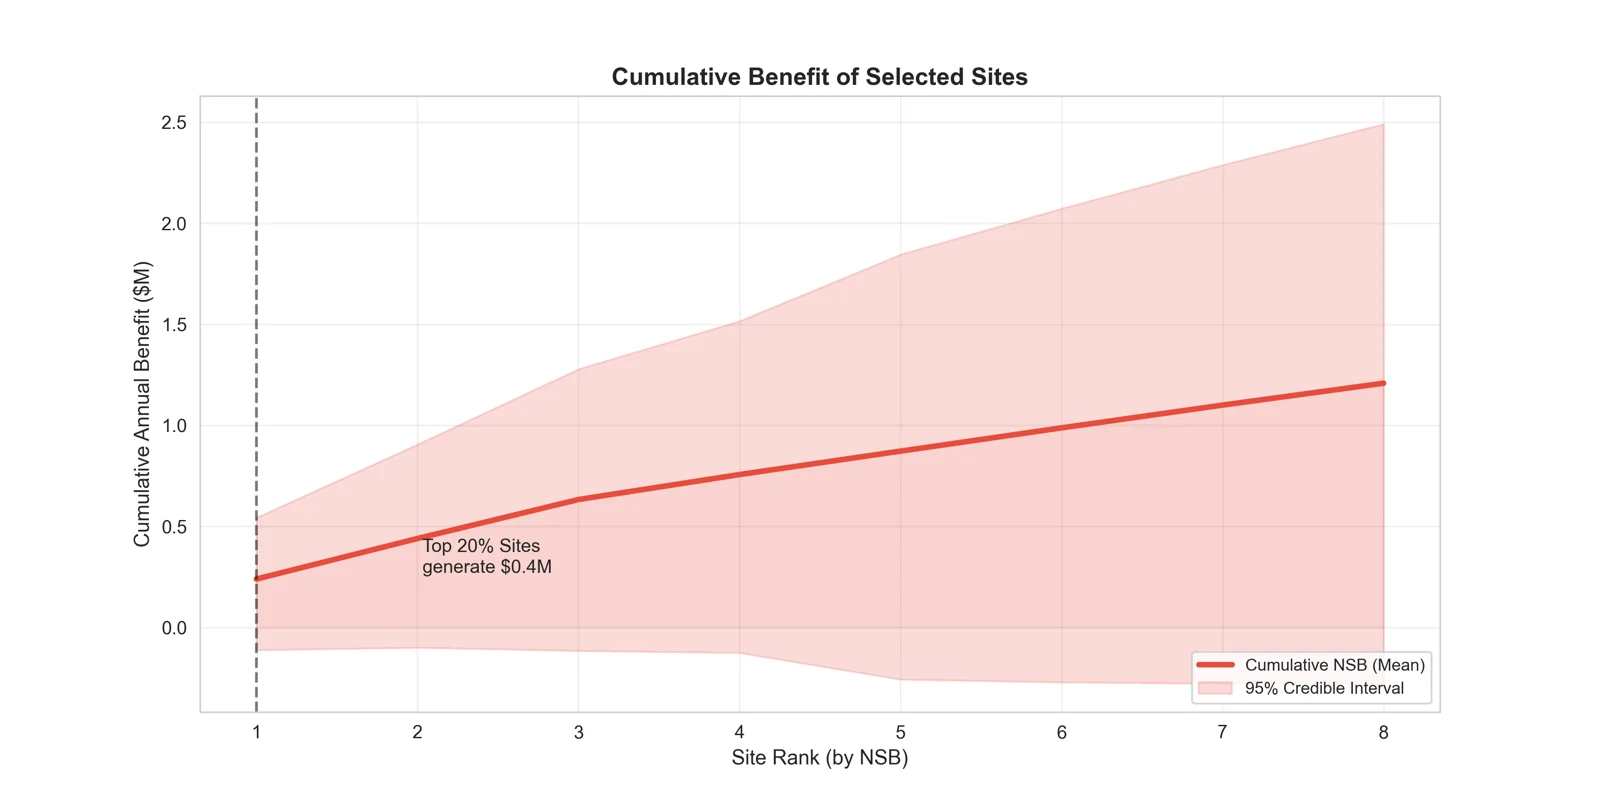
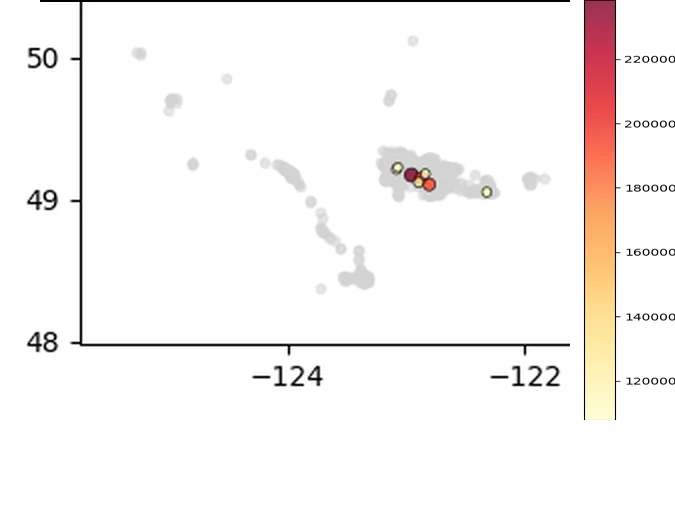
A tool leadership can use for any budget.
Leadership got an interactive dashboard that returns the best sites, with credible intervals, for any budget from $1M to $10M.
Made crash costs configurable for when the data arrive.
I left a plan to close each remaining data gap after handover.
Crash costs are configurable inputs pending ICBC data, so dollar values show how the method ranks sites, not audited savings.
What it found
- Prediction error fell 60% against a model without spatial correlation.
- Leadership got an interactive dashboard that returns the best sites, with credible intervals, for any budget from $1M to $10M.
- I left a plan to close each remaining data gap after handover.
- BYM2 spatial model
- Monte Carlo
- CuPy
- MILP
- Genetic algorithms
- Decision support