PhD research · University of British Columbia · 2020–2025
Real-time crash risk from self-driving vehicle data
Can self-driving vehicles tell us how dangerous a road is right now, before anyone crashes?
- hours of AV perception data
- 1,000+
- study sites on the Las Vegas Strip
- 13
- of local data needed to transfer a model
- 20%
- first-author journal papers
- 4
Crashes are a poor teacher.
Road crashes kill about 1.35 million people a year, yet safety analysis still waits for crashes to happen and then counts them. Crashes are rare, they take years to accumulate, and every one is harm that has already happened.
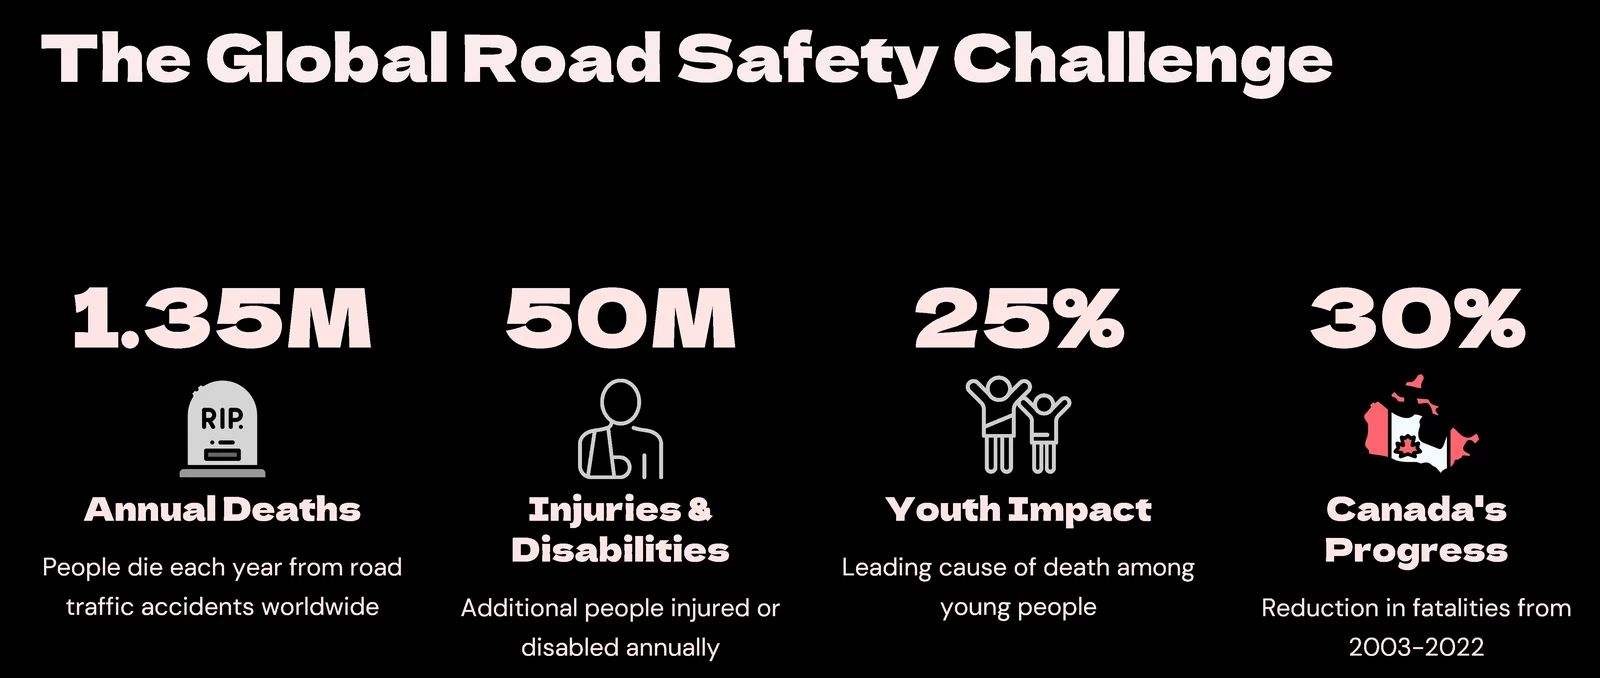
- Crash data scarcitytraditional safety analysis relies on historical crashes, but crashes are rare, and counting them is reactive.
- Real-time requirementsautomated vehicles need safety decisions in the moment, not after-the-fact analysis.
- Modelling extremessafety is about predicting rare, severe events, not averages.
- Transferability gapmodels trained in one city often fail elsewhere because traffic patterns differ.
Learn from near-misses instead.
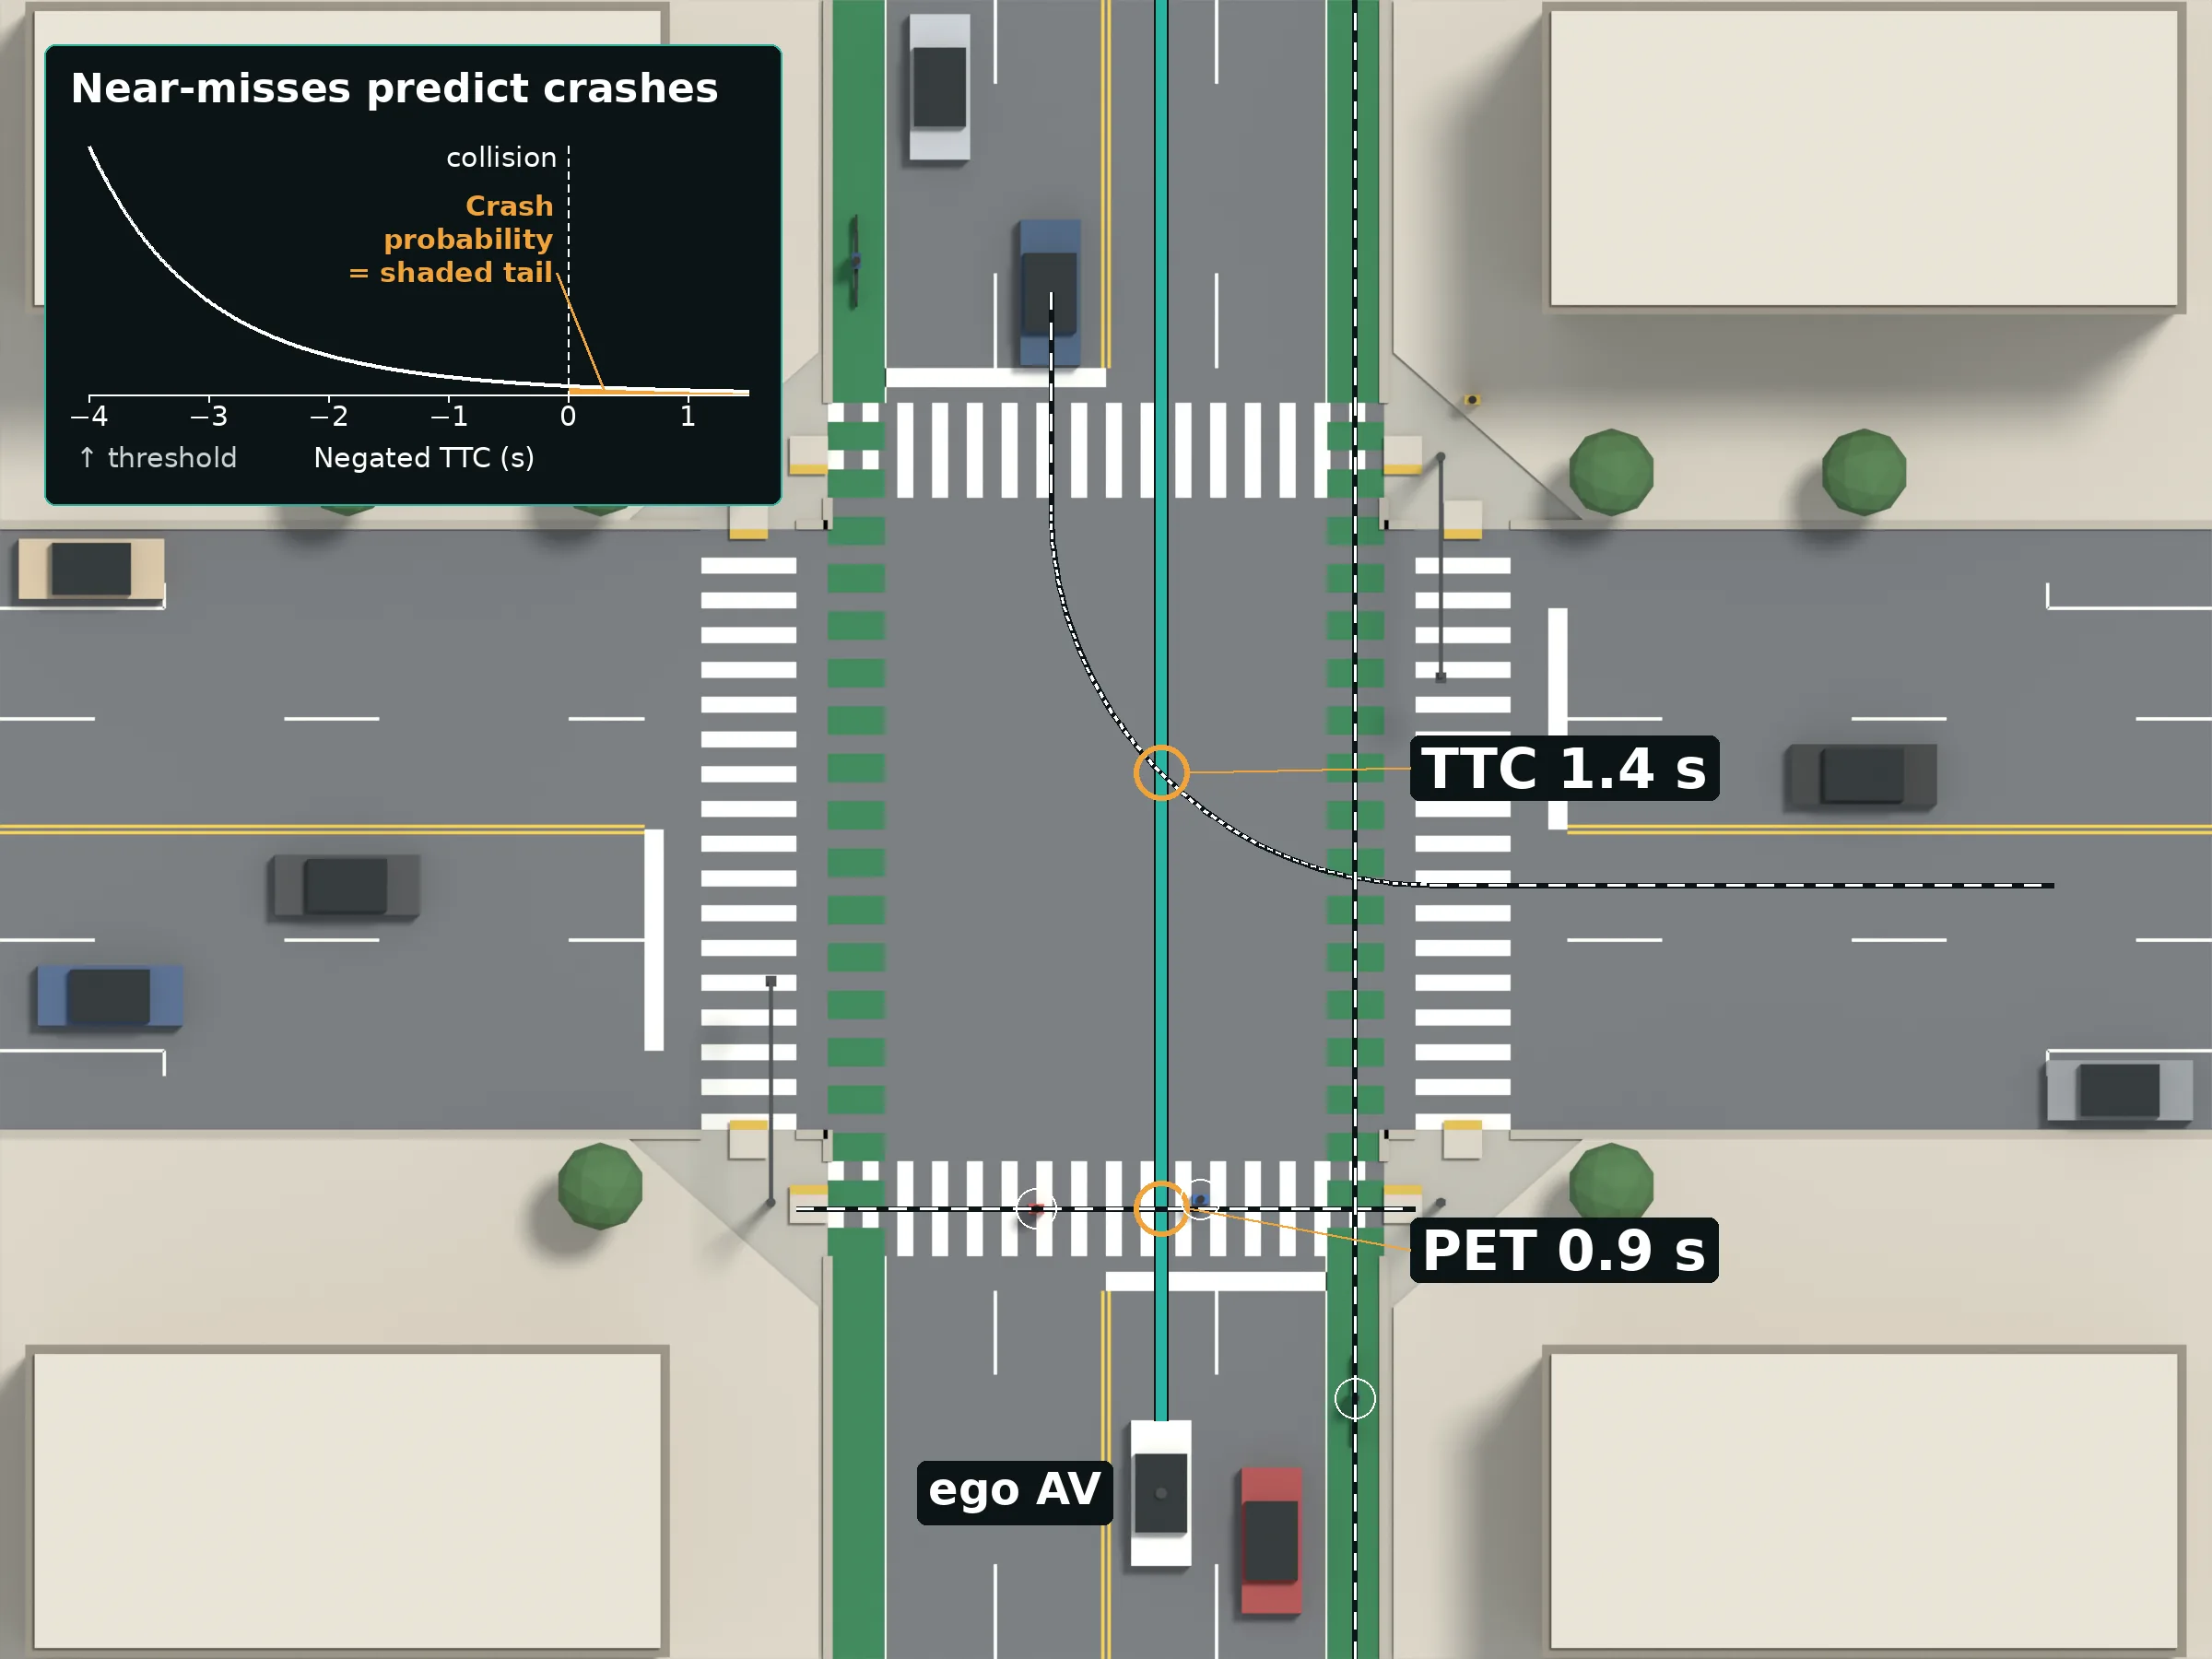
Automated vehicles record near-misses all day. The approach models the most extreme of them and turns them into a crash probability for each short interval, with models that can move from a data-rich city to a data-scarce one.
Real sensor data, cleaned site by site.
Cleaned 1,000+ hours of Lyft and nuScenes perception data, removing duplicate detections from overlapping vehicles, parked cars and out-of-bounds objects.
Extracted traffic conflicts, such as time-to-collision and post-encroachment time.
From near-misses to a crash probability.
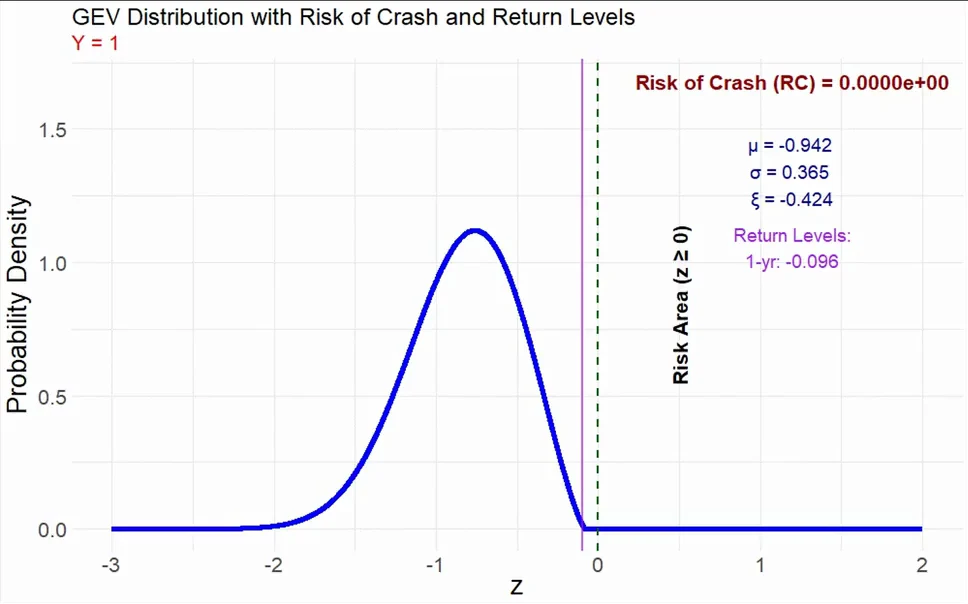
Built Bayesian hierarchical spatial extreme value models that estimate the risk of a crash, and the safety margin, in each short interval.
Checking a model when crashes are missing.
Validated the models where no matching crash records existed, using crash-independent criteria built from observed extreme conflicts.
What it found
- Models trained on 68,000 conflicts in Las Vegas held up on 35,000 conflicts in Palo Alto, and stayed reliable with only 20% of the local data.
- Bivariate peaks-over-threshold models beat block maxima for intervals under 5 minutes.
- Crash risk peaks in congested, turbulent flow.
- Published in 4 first-author journal papers.
- Real-time crash risk estimation with autonomous vehicle data: a comparative analysis of extreme value modelsTransportmetrica A: Transport Science · 2025
- Real-time combined safety-mobility assessment using self-driving vehicles collected dataAccident Analysis & Prevention · 2024
- Transferability of real-time EVT safety models: an investigation using autonomous vehicles dataTransportmetrica A: Transport Science · 2024
- Real-time safety analysis using autonomous vehicle data: a Bayesian hierarchical extreme value modelTransportmetrica B: Transport Dynamics · 2023
- Extreme value theory
- Bayesian hierarchical models
- Stan
- Conflict analysis
- Transferability